The histogram is one of the most reliable tools in photography because it allows photographers to understand exposure and get it right every time. Histograms are extremely important because the camera’s LCD screen doesn’t always accurately represent the image; however, the histogram can’t be wrong. It can be quite useful to frequently look at the LCD after taking a shot and adjust your settings according to the histogram rather than according to the image preview.
This is especially true in the case of landscape photography, because it can be really hard to rely on your image preview when you shoot outdoors and lighting conditions are changing all the time. Because of this, the histogram should be the best friend of every serious landscape photographer.
What Is A Histogram?
If you still don’t know much about histograms, don’t worry – we’ll make sure to explain them in a simple way.
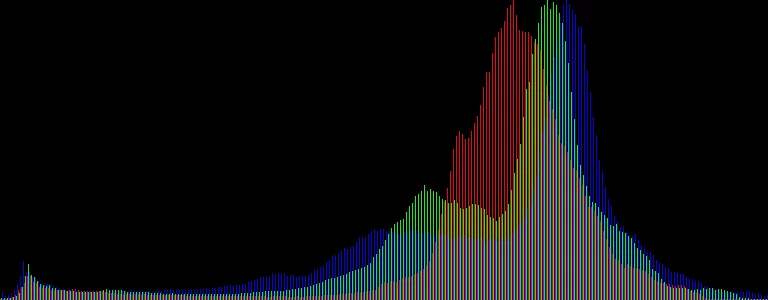
Histograms are simple graphs that display where all of the brightness levels contained in the scene are found, from the darkest to the brightest ones. You will notice that these values are spread across the bottom of the graph from left (darkest) to right (brightest).
You should also pay attention to the vertical axis of histograms – it is the height of points on the graph. The vertical axis shows how much of the image is found at any particular brightness level.
If you’re wondering how your camera creates histograms, here’s the easiest explanation – the camera converts the image to grey-scale and divides it into 256 levels of brightness, starting at 0 (pure black) and going up to 256 (pure white). Then camera analyzes each pixel of the image and displays this information in the histogram chart.

Good And Bad Histograms
You have probably heard about the term ’’perfect histogram’’. It looks like a bell-shaped curve, all its tones fall within the edges (there is no underexposure and burnt-out highlights) and it displays a fairly even distribution of tones.
However, it’s often impossible to achieve this kind of histogram and you should also remember that the best shape of the histogram depends on the content of the individual image. Some photos will look better if you aim at an evenly distributed curve, while others are perfectly fine even though their histogram doesn’t stick to the basic rules.
However, there are certain situation you should avoid, no matter the content of your image. Bear in mind that histograms that are very heavily bunched up to the right (overexposed) or to the left (underexposed) mean that the image in poorly exposed. While portraiture (mostly studio sessions) can be highly futuristic and avant-garde in terms of exposure, this is usually not the case with landscape photography.
Why Understanding Histograms Matters
If you’re still not convinced about the importance of histograms, you should consider the following facts:
- The histogram is always an accurate representation of your image’s brightness levels.
- Using the histogram is the only foolproof way of analyzing if an image is too dark or too bright
- Ultimately, understanding the histogram will help you improve your photos and make them more balanced.
You can analyze the histogram directly on your camera’s LCD screen or do it later while post-processing. Both Photoshop and Lightroom will allow you to read histograms. You can also choose how you want to preview your histogram by switching among the following channels – RGB, Red, Green, Blue, Luminosity, and Colors.
Examples Of Histograms In Landscape Photography
Now we’re going to analyze a couple of different photos and their histograms so that you can understand what kind of information can be derived from histograms and how to use it to improve the image.

The image above is a classic example of the so-called ”perfect histogram”. Its curve shows a well-exposed picture (evenly distributed bars) and well-controlled dark and light areas (falls off in both ends). Because of this, there is no loss of detail – the tonal range is just right for this particular scene.

While this image doesn't have the ideal histogram, it's still a good example of a well-exposed image. It has a rich tonal range and high saturation over a broad range of tones. Even though there are some blown highlights and underexposed parts (in the right corner of the image), they aren't dominant and the photo still looks balanced enough.

This photo is somewhat problematic – its overexposure resulted in a histogram that slides to the right. There is also some underexposure in the upper left corner of the image. In addition to these two issues, the picture has a blue tint, which is a white balance problem. Skillful editing could certainly improve this photo.

The last image we'll analyze is an example of an underexposed photo. There is definitely a lack of bars on the right side of the chart, which means there are no bright tones. Lots of dark details have been lost and the whites aren't white enough. However, you can still fix this image in Lightroom or Photoshop, especially if it was shot in RAW.
We hope this simple tutorial helped you understand histograms better and that you’ll start using the histogram review feature on your camera or in editing software.
In case you want to learn more about histograms and landscape photography, feel free to check out the following links!
Further Resources:
- 3 Quick Photoshop Tips To Improve Any Landscape Photo
- What You Need To Know About Light For Better Landscape Photography
- Bite Size Tips: Use This Quick Checklist Before Every Landscape Photo
- How To Read And Use Histograms
- Learn The Exposure Triangle And Histograms For Better Landscape Photography
- Histogram In Photography
Don't forget our wonderful resource page on Landscape Photography – we love that you can get all these resources in one place and we hope it helps you to become a great landscape photographer.
Further Learning:
If you've ever wondered why a scene, that looked so gorgeous in person, now looks flat and uninteresting in your photograph or if you've ever returned from vacation feeling dissatisfied because your images did not capture the natural beauty that you witnessed with your own eyes then The Complete Landscape Photography Guide is for you.
This guide, by award-winning author and photographer Kent DuFault, will show you how:
- To choose the right camera and lenses for Landscape Photography
- To find (and capture) the unique images that nobody else gets
- A pro shoots AND post-processes their images for art gallery quality!
- Your chosen POV, can make, or break, your image
- To shoot landscape photography at night! Including how to capture beautiful star trails
- To properly use graduated filters…for spectacular results
- And much more


1 Comment
Small point: if the histogram starts at 0 as its darkest level (pure black) and spans 256 levels, the brightest level (pure white) is 255, not 256.